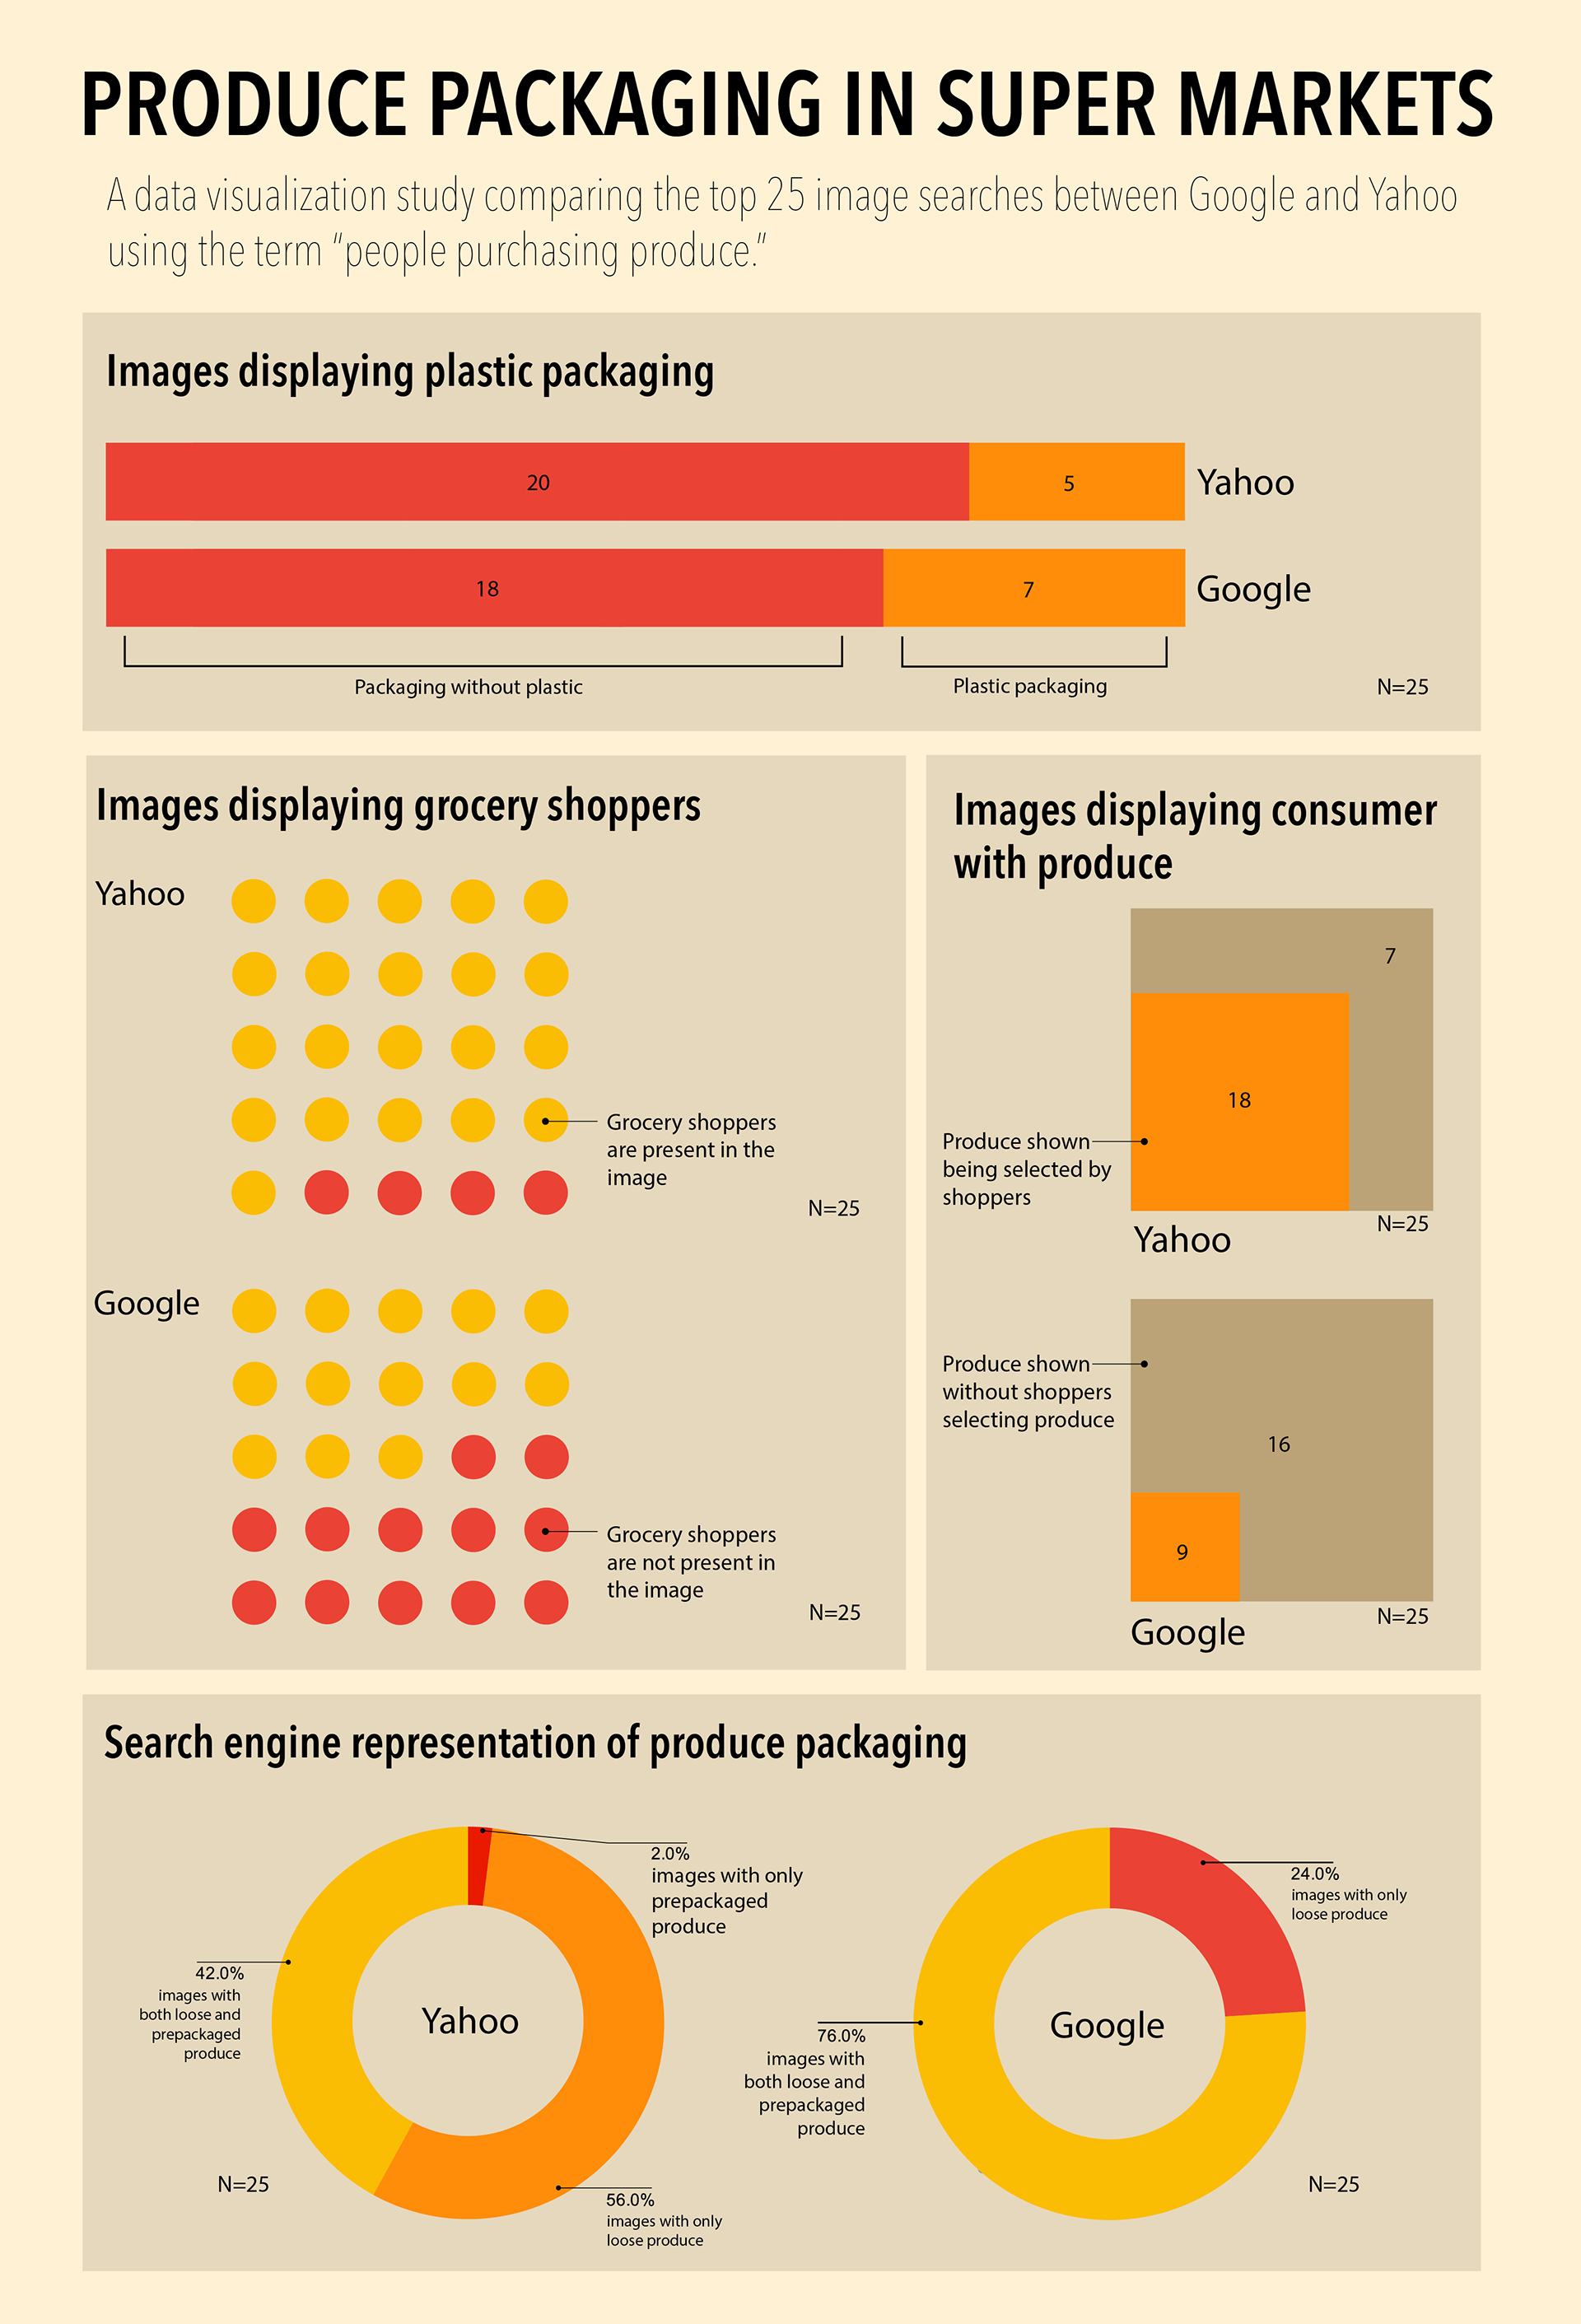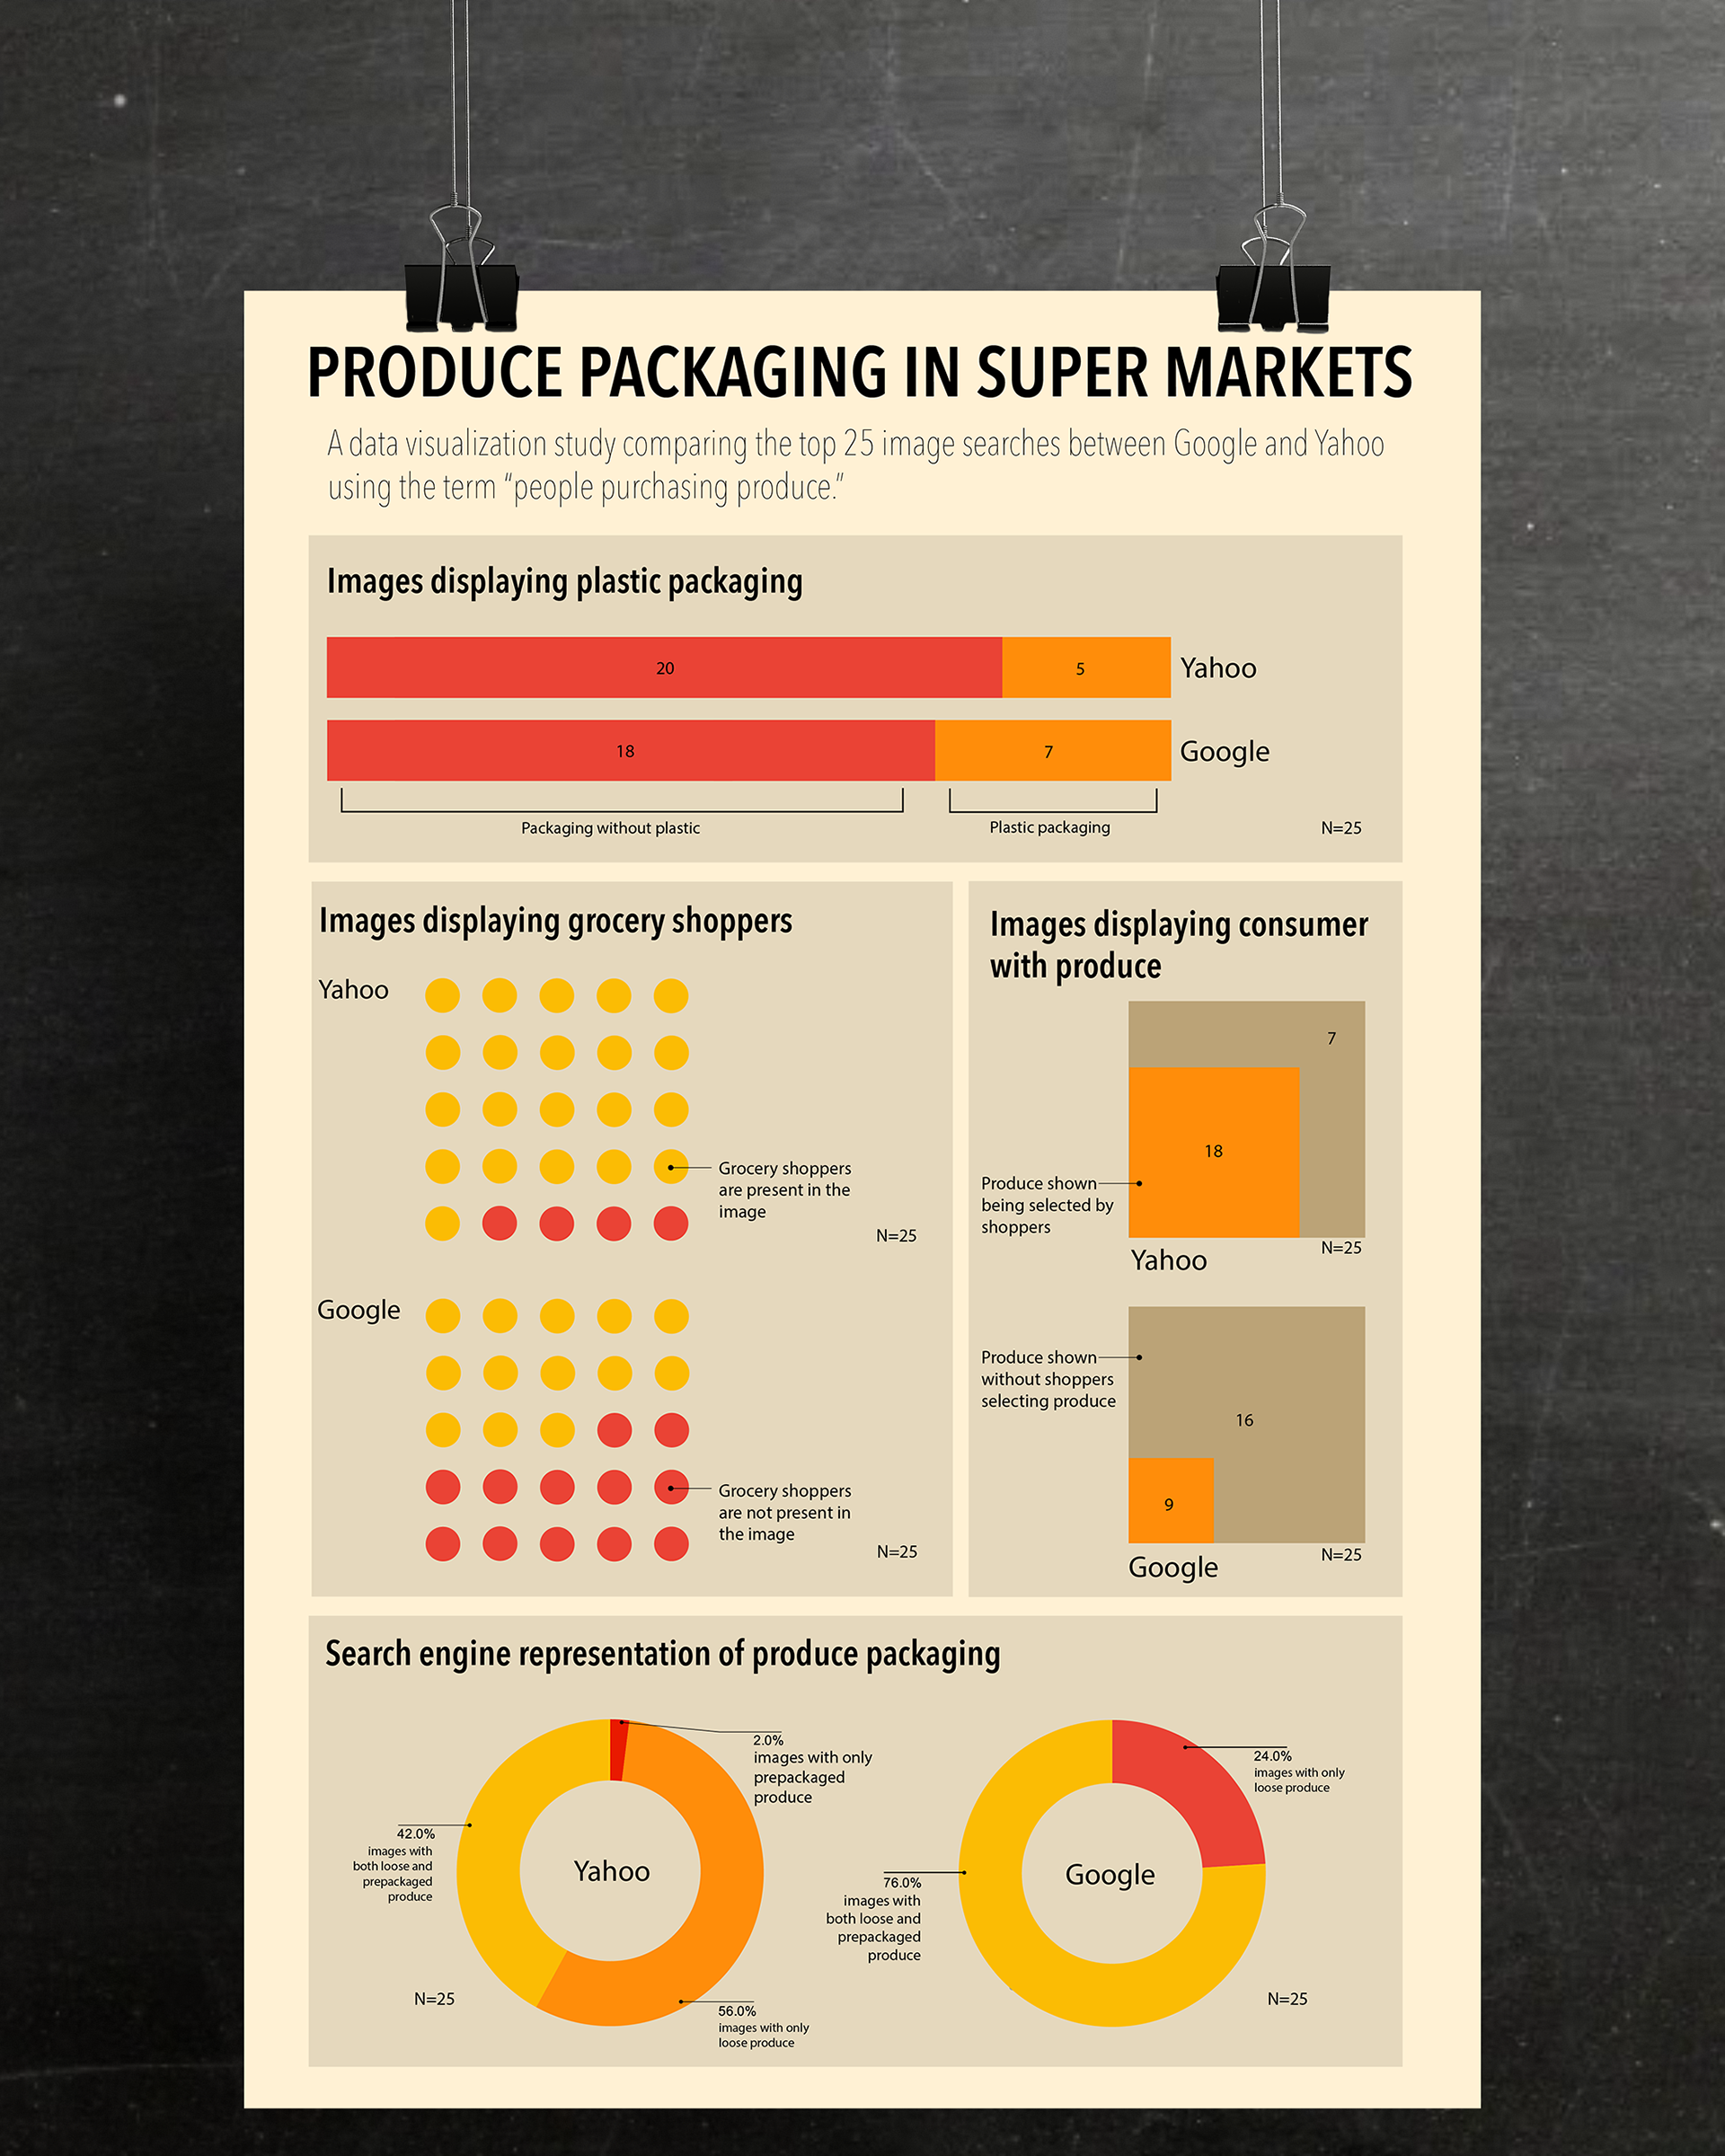
As part of my Data Visualization coursework, we were asked to gather search engine data based off of the United Nations 12 sustainability goals. I choose to statistically capture how produce packaging was displayed on search engines. The Infographic below conveys how both Google and Yahoo displayed produce packaging
Data Visualization - Fall 2020